


C
Jupiter Exchange enables INJ swaps for SOL and SPL tokens
The integration enhances cross-chain liquidity and trading efficiency, potentially boosting Solana's ecosystem and Injective's market reach.
 CryptoBriefing•Editorial Team4h ago
The integration enhances cross-chain liquidity and trading efficiency, potentially boosting Solana's ecosystem and Injective's market reach.
CryptoBriefing•Editorial Team4h ago
ETF flows are also positive.
 AMBCrypto•Samyukhtha L KM4h ago
The discovery highlights the need for rigorous security audits in blockchain proposals, as overlooked vulnerabilities can jeopardize system integrity.
CryptoBriefing•Editorial Team4h ago
Solana just took the most historic step in its governance history: its first real on-chain vote, where any SOL holder — not just validators — could weigh in on the network's constitution, inflation and fees. Camila Russo sits down with Nick Almond, Head of Governance at the Jito Foundation, right
 The Defiant•Camila Russo6h ago
Price defended the Wholesale Area and is reclaiming $100. That’s the dip, not the breakdown. Thesis 2022–23 base is the Secondary Wholesale Area. This year’s pullback into $65–$100 is the higher-timeframe discount. The red Retail Zone ($175–$260) is where the last cycle dumped inventory. If wholesale holds, that’s the magnet. Structure: higher-low off demand, bounce through $100, room into old supply. Trade Bias: Long Entry: $96–$102 on holds / shallow retests of the wholesale top Aggressive add: break-and-hold above $105–$110 Invalidation: weekly close back through the wholesale floor, ~$64–$68 Hard stop: below $64 Targets $130–$145 (range mid / first supply) $175 (bottom of Retail Zone) $220–$250 (heart of Retail Zone) From $100 with a stop under $64: T1 ≈ 1R–1.3R T2 ≈ 2R+ T3 ≈ 3R–4R That’s the asymmetry. What confirms Weekly closes holding above $96–$100 Higher low if it retests $85–$92 and buyers show up Acceptance above $110 opens the run into retail What kills it Lose $64 on a weekly close. Then you’re not buying wholesale anymore — you’re catching a falling knife into the secondary box. Size it for crypto. SOL can do 4% days. The idea is good; the path will not be clean. Not financial advice.

The INJ token's integration into Solana enhances multi-chain accessibility, fostering innovation and liquidity in decentralized finance ecosystems.
CryptoBriefing•Editorial Team11h ago
ASTER/USDT is printing one of the cleaner textbook reversal structures on the daily chart, and it lines up almost perfectly with the token's first TGE anniversary (17 Sep 2025). Here is the sequence the market has walked through, step by step: 1. Exhaustion of the downtrend. From the November highs, price carved a series of lower lows and lower highs — a healthy, orderly markdown. This is the phase where late longs are flushed and supply is transferred to stronger hands. 2. Bullish divergence at the lows. As price pushed to fresh lows into February, the oscillator refused to confirm — momentum was rising while price was falling. That classic bullish divergence is typically the first tell that sellers are losing control. 3. Accumulation. Since February, price has traded sideways in a well-defined accumulation box between roughly 0.60 and 0.74. Volatility compressed, the moving averages coiled and flattened, and the range tightened — the signature of quiet distribution being absorbed before an expansion move. 4. On the brink of breakout. Price is now pressing the upper boundary of the box and has reclaimed the fast MAs. A daily close and hold above the entry trigger would confirm the range break and open the path toward the major resistance shelf. One honest caveat: a short-term bearish divergence has formed on the recent local high (visible on both price and the oscillator). That argues for patience — I want confirmation above the trigger rather than front-running the box. If the breakout fails and price loses the range, the structure is invalidated and the thesis is off the table until it rebuilds. FUNDAMENTAL BACKDROP The technical setup does not exist in a vacuum — the fundamental tape for ASTER is unusually constructive: What Aster is: a multi-chain perpetuals DEX (spot + perps across BNB Chain, Ethereum, Solana and Arbitrum) built from the 2024 merger of Astherus and APX Finance. It has positioned itself as a direct challenger to Hyperliquid, with hidden orders, MEV-resistant execution, stock/RWA perpetuals and yield-bearing collateral. It is backed by YZi Labs (formerly Binance Labs). Aggressive deflationary tokenomics. Since the June 2026 overhaul, up to 99% of daily platform fees are routed into ASTER buybacks for stakers, with a matching burn from reserves — a self-reinforcing loop where higher trading volume directly tightens supply. Cumulative burns have run into the hundreds of millions of tokens. Supply overhang removed. On 1 Sep 2026, the team extended the cliff on its 400M-token allocation (5% of supply) by a full year to 17 Sep 2027. Tokens that many feared would begin unlocking this month are now locked for another year — a materially cleaner near-term supply path than most peers carry. Product expansion. The Aster Chain L1, on-chain governance, staking, and RWA market growth continue to broaden the fee base — which, under the current model, feeds directly back into buyback pressure. Net read: strong deflationary mechanics plus a removed unlock overhang are exactly the kind of fundamental tailwinds that convert a technical accumulation into a sustained trend. TRADE PLAN Parameter Level Entry (on confirmed breakout) ~0.873 Take Profit 1 ~1.20 Take Profit 2 ~1.372 (major resistance) Stop Loss ~0.656 (below accumulation box) Execution notes: Trigger the long only on a decisive daily close and hold above ~0.873; avoid anticipating the box break given the local bearish divergence. Reclaiming and holding this level opens the door to the 1.20 shelf, with 1.372 as the extended target into major resistance. Scale out partials at TP1 and move stop to breakeven to lock in a risk-free runner toward TP2. Invalidation is clean: a breakdown and daily close below the box lows negates the setup. Not financial advice. This is a personal analysis shared for educational purposes — always do your own research and manage risk according to your own plan.
Solana price rose back above $100 after buyers defended the $95–$96 support zone, but technical resistance and concentrated liquidation levels near $102 could determine whether the rebound develops into a wider recovery. Solana price rebounds from $96 support Solana (SOL)…

Hyperliquid's rise highlights the growing specialization of blockchain ecosystems, impacting stablecoin distribution and market dynamics.
CryptoBriefing•Editorial Team11h ago
Solana recently reported that its on-chain trading volume is 12.6 times greater than that of traditional stock exchanges, a significant metric in the evolving landscape of digital assets. This tweet, shared by the Solana account, showcases the growing interest in blockchain technology as a primary trading venue. The implications of this shift could influence market dynamics and trading strategies moving forward. The Key Development This latest insight from Solana underscores a critical transition in market behavior, where on-chain trading is increasingly preferred over traditional exchanges. The data suggests that traders are recognizing the benefits of blockchain’s efficiency and transparency, which could lead to more participants entering the crypto space. As the broader crypto market exhibits mixed signals, this surge in on-chain activity may signal a burgeoning acceptance of decentralized trading platforms. Key Takeaways Solana’s on-chain trading volume is now 12.6 times higher than traditional exchanges. This data reflects a notable shift in trading preferences among market participants. The increased on-chain volume could enhance liquidity in the Solana ecosystem. Traders may capitalize on the efficiency of blockchain technology for transactions. This trend may influence future trading strategies in the crypto market. Market Pulse Despite the broader crypto market showing mixed signals recently, Solana’s reported surge in on-chain trading volume is a noteworthy exception. This substantial increase indicates that traders are increasingly favoring blockchain-based transactions over traditional market methods. With no current price action available for Solana, this focus on trading volume suggests a potential shift in market sentiment towards decentralized trading solutions. Solana is a high-performance blockchain platform that supports decentralized applications and crypto projects, facilitating rapid transaction speeds and low fees. The growing on-chain volume highlights Solana’s role in revolutionizing how trading occurs, potentially drawing more users from traditional financial systems. What Comes Next Traders should keep an eye on Solana’s evolving market position as more users shift towards on-chain trading. The increasing volume could lead to heightened liquidity and more robust market dynamics. Observing how this trend develops will be crucial, especially as the crypto landscape continues to adapt to new technologies and user preferences. The information provided is for informational purposes only and should not be considered financial advice.
SOL's price action could go in either direction in the near term.
AMBCrypto•Ishika Guha12h ago
Galaxy Curation's expansion into Solana via Kamino vaults signifies a growing institutional interest in DeFi, enhancing risk-managed yield opportunities.
CryptoBriefing•Editorial Team13h ago
Family offices' cautious approach to Hyperliquid suggests a gradual shift in investment strategies, potentially impacting future market dynamics.
CryptoBriefing•Editorial Team14h ago
London, United Kingdom, September 17th, 2026, Chainwire. New developments extend BASIS across real-world asset and AI-native infrastructure while introducing automated reward restaking for BTC, ETH, SOL, and PAXG participants BASIS, the institutional-grade crypto yield and staking platform built on market-neutral execution infrastructure, is continuing to expand its institutional footprint with three new developments: an ecosystem […]
 Bitcoin.com News•Media15h ago
The best part of a correction is not catching the exact bottom — it is knowing where the market must prove itself. PUMP is still moving inside a descending corrective channel on the 4H chart. Price has now reached an important support / pullback zone, which makes this area interesting for a possible long setup. But I don't want to chase the first green candle. There are two possible ways to approach this setup: Setup Scenario 1 — Buy the Pullback Price holds the marked support zone around 0.0035–0.0037 and gives us bullish price action, rejection, or a strong confirmation candle. → Possible entry after confirmation → Invalidation: 0.0030 Scenario 2 — Buy the Channel Breakout If price breaks the upper boundary of the descending channel with a strong candle, I would rather wait for a retest and confirmation instead of buying the initial breakout. The breakout would provide stronger confirmation that the correction is losing control. Targets 🎯 Short-Term Target: 0.0050 🎯 Mid-Term Target: 0.0060 The 0.006 target also lines up with the 61.8% Fibonacci level shown on the chart. The important point is that 0.0030 remains the invalidation level. If that level is lost, the current bullish setup needs to be reassessed. Why is Pump.fun interesting fundamentally? Pump.fun is not simply another memecoin. It operates a large token-launch and trading infrastructure on Solana. New tokens begin on a bonding curve, meaning price discovery happens automatically through the protocol rather than through a traditional order book. Once a token reaches the graduation threshold, its liquidity is automatically migrated to PumpSwap. The platform also generates actual protocol revenue from trading activity. For example, Pump.fun's current fee structure includes creator fees, protocol fees and liquidity fees, with the bonding-curve trading fee currently listed at 1.25% total. This is one of the more interesting aspects of the project: More launches → more trading activity → more fees → more protocol revenue. Pump.fun passed 1 billion Dollar in cumulative revenue earlier in 2026, according to data reported by The Block. There is also an important token-economic component. Pump.fun announced a programmatic buyback-and-burn model using 50% of future revenue for buybacks and burns, following a large PUMP burn earlier in 2026. That gives PUMP an economic connection to the activity of the platform that many purely speculative tokens don't have. But this doesn't mean the token automatically goes higher. One important warning Pump.fun's business is heavily dependent on trading activity and speculation around new tokens. That activity can change very quickly. In June 2026, The Block reported that Pump.fun's activity and revenue had fallen sharply from previous highs, with average daily revenue around 800,000 Dollar versus approximately 4.8 million Dollar six months earlier. So when looking at PUMP, I would watch more than just the chart: Platform activity → Trading volume → Revenue → Buybacks/burns → Token supply → Competition There are also newer features such as Holder Rewards and experimental AI-related mechanisms such as Mayhem Mode, showing that Pump.fun is trying to evolve from a simple memecoin launchpad into a broader token-launch ecosystem. That's what makes PUMP interesting to watch — but also what makes it highly sensitive to changes in user activity and market sentiment. My approach I would not chase the current move. The interesting area is the marked pullback/support zone. If buyers defend it → look for confirmation. If the descending channel breaks → wait for the retest. If 0.0030 breaks → the bullish setup is invalidated. The market doesn't owe us a trade. We wait for it to prove the setup. Risk Warning: This is a technical and educational market analysis, not financial advice. PUMP is highly volatile and can experience significant losses. Always define your risk before entering a trade.
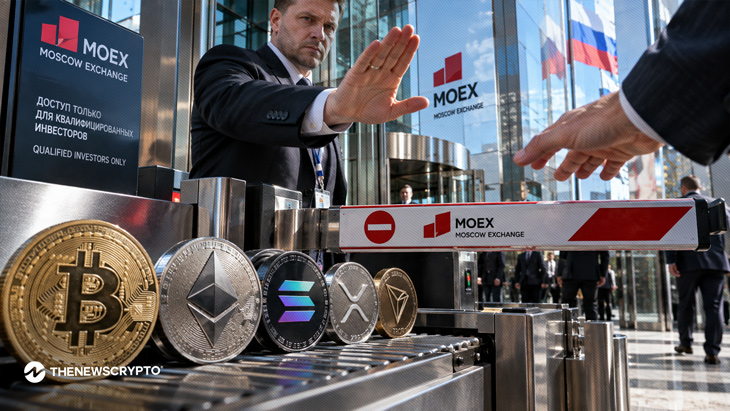
Moscow Exchange, Russia’s largest stock exchange, has announced the launch of perpetual futures contracts on five major cryptocurrency indices starting September 22, 2026. The new instruments cover Bitcoin (BTC), Ethereum (ETH), Solana (SOL), Ripple, and Tron. It is traded under contract codes BTCUSDF, ETHUSDF, SOLUSDF, XRPUSDF, and TRXUSDF, respectively. The
 TheNewsCrypto•Sarayu Krishna15h ago
SOL has staged a recovery from the 96.80–98.90 support zone and is now pushing higher toward the descending trendline. Price is reclaiming the short-term moving-average area, while the trendline around 103.50–104.00 remains the key resistance to overcome. 🟦 Support Zone: 96.80–98.90 🟢 1st Resistance Objective: 104.00–104.20 🟢 2nd Resistance Objective: 108.00–108.20 📈 Bias: Recovery structure, with breakout confirmation required. A sustained move above the descending trendline and 104.00 resistance could strengthen the recovery toward 108.00–108.20. If price fails at the trendline, the 98.90–96.80 area remains the key support region to watch.

Institutional shifts towards smaller crypto ETFs like Solana and XRP may signal growing diversification and confidence in altcoins.
CryptoBriefing•Editorial Team18h ago
Seeing CRYPTOCAP:SOL push back to $100.xx and feeling the urge to FOMO buy? Take a step back and look at the market structure: 📌 TECHNICAL BREAKDOWN Wave (B) Corrective Push: Today's bounce from $96.83 is a textbook Wave (B) corrective retest, currently testing the 0.5 ($100.28) – 0.618 ($101.32) Fibonacci retracement cluster. Confluence Resistance: The descending channel trendline combined with heavy overhead supply blocks continues to cap any further upside momentum. Key Invalidation Level: As long as price remains below $106.93, the primary Bearish Impulse count pointing toward lower demand zones remains fully active. 💡 SPOT TRADING ACTION PLAN AVOID BUYING AT $100.xx: This is a No Man's Land. Buying inside Wave (B) offers a terrible Risk-to-Reward ratio. IDEAL BUYING SETUPS: Discount Scenario: Patiently wait for Wave (C)/(5) to complete near the main demand zone at $89.75 – $86.73. Breakout Scenario: Wait for a confirmed 4H candle close above $107.50 before flipping fully bullish. Protect your USDT/FDUSD cash position and let the market confirm its true direction! 🛡️ #Solana #SOL #CryptoAnalysis #TechnicalAnalysis #ElliottWave #BinanceSquare

MOEX will launch perpetual futures tied to BTC, ETH, SOL, XRP and TRX indexes on Sept. 22 for qualified investors, settled in rubles.