BTC | Structure Shifted, Five Pools Sit Above
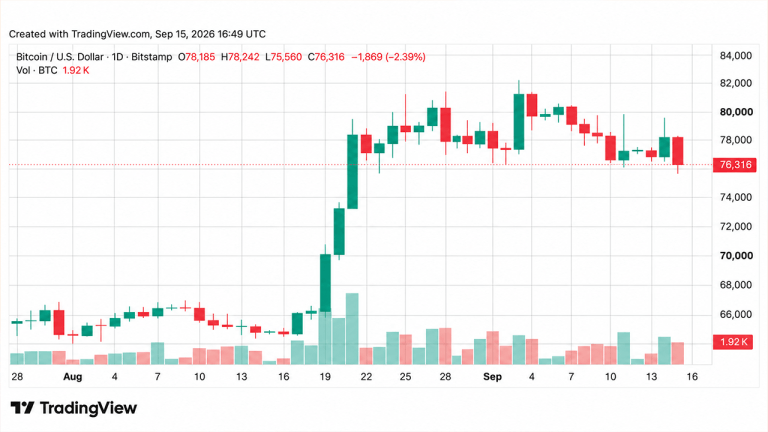
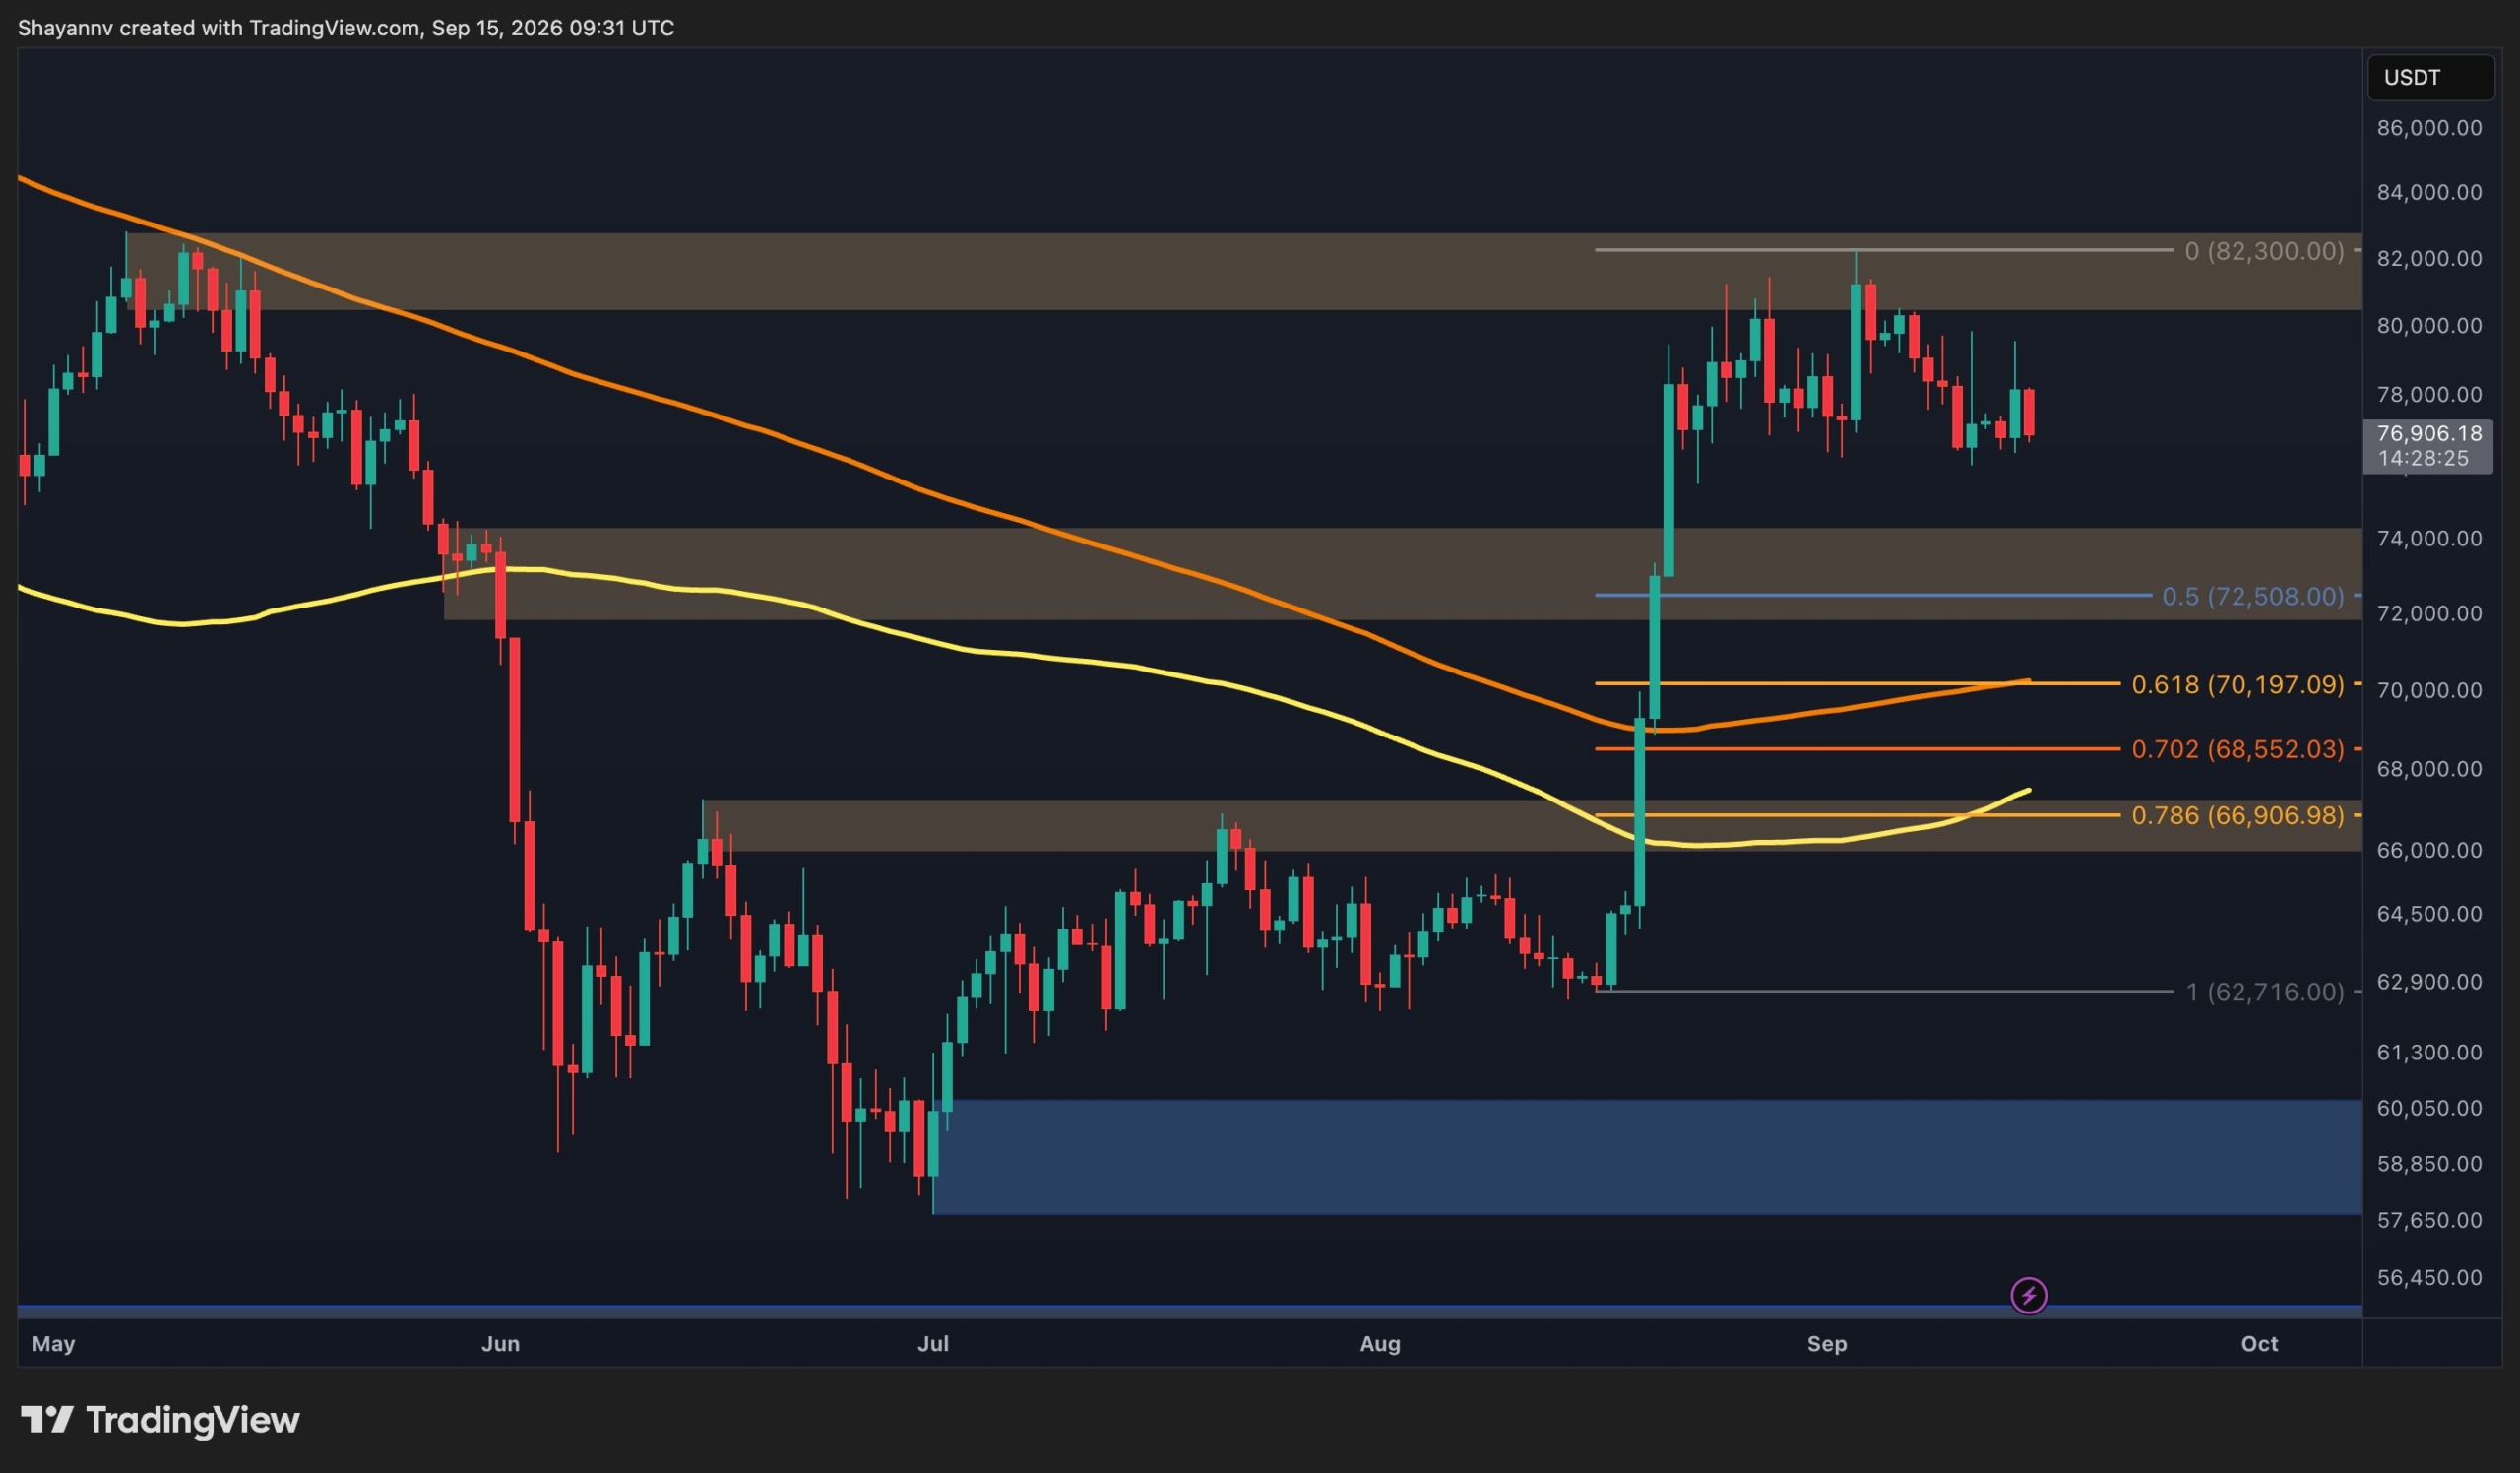
By analyzing the #BTC (Bitcoin) chart on the Daily timeframe, we can see a market that spent almost a year making lower lows, swept the liquidity beneath them, and has since shifted structure upward with enough force that the entire range above is now unclaimed liquidity.
━━━━━━━━━━━━━━━━━━━━
DAILY TIMEFRAME
━━━━━━━━━━━━━━━━━━━━
The downtrend. From the November high at $116,323.39 price moved in one direction. Each rally failed lower than the last, and in February the BMS confirmed it — the November swing low was broken and the bearish structure was formally set. Every bounce after that was sold into.
The sweep. The low did not come from strength. In early July price drove through the February low into the stops resting beneath it — a clean liquidity sweep — and printed the Protected Low at $57,664.45 . That is the origin of everything that followed.
The shift. From that low price built a base through July and August, then in late August broke the structure to the upside with the MSS . The way it broke matters more than the fact that it broke: the move left clear bullish fair value gaps behind it and expanded vertically rather than grinding. Displacement like that is how a real shift looks. Price is now at $77,037.28 .
━━━━━━━━━━━━━━━━━━━━
THE LIQUIDITY ABOVE
━━━━━━━━━━━━━━━━━━━━
Five untouched pools of buy-side liquidity sit overhead, each one an old high that was never revisited:
BSL 1 — $82,875.74
BSL 2 — $90,609.88
BSL 3 — $98,042.69
BSL 4 — $107,584.81
BSL 5 — $116,323.39
A high that has never been defended isn't resistance, it's a target. Five of them stacked in sequence is the road map for the rest of this move.
━━━━━━━━━━━━━━━━━━━━
THE BIAS
━━━━━━━━━━━━━━━━━━━━
Bullish. The structure shifted, the displacement was real, and the liquidity is all on one side.
━━━━━━━━━━━━━━━━━━━━
SCENARIO A — THE BASE CASE
━━━━━━━━━━━━━━━━━━━━
Chasing here is the worst version of this idea. The better entry sits below the 0.5 retracement of the impulse leg — the area just above $70,000 . Price is extended from its origin, and a pullback into discount is the normal behaviour after displacement of this size.
The first objective on a reaction from there is BSL 1 at $82,875.74 , and above it the ladder opens.
━━━━━━━━━━━━━━━━━━━━
SCENARIO B — THE DEEPER RETRACE
━━━━━━━━━━━━━━━━━━━━
The stronger area is lower. The RBS zone at $65,097.26 – $67,206.58 is where the resistance that capped price from April through August was broken and flipped. It also overlaps the 0.62 ($67,206.58) and 0.705 ($65,097.26) retracement levels of the same impulse.
Broken resistance, deep discount and a fib cluster in the same band is as much confluence as this chart offers. If price reaches it and the daily prints a buy signal there, that is the high-conviction entry — same targets, materially better price.
━━━━━━━━━━━━━━━━━━━━
INVALIDATION
━━━━━━━━━━━━━━━━━━━━
A daily close below the Protected Low at $57,664.45 . That level is the origin of the shift; beneath it the July sweep failed and the bullish structure is gone.
An earlier warning comes first: a daily close below $65,097.26 that does not reclaim means the RBS zone failed as demand, and the entry thesis is broken well before the structure is.
And the rule that governs all of it: a break is a candle close, not a wick. The RBS zone is exactly where a wick beneath will look like failure and close back inside — that band held price for four months, which means it is thick with stops on both sides, and thick stop clusters are what wicks are made from.
━━━━━━━━━━━━━━━━━━━━
FUNDAMENTAL BACKDROP
━━━━━━━━━━━━━━━━━━━━
The supportive side. US spot Bitcoin ETFs just closed their strongest three-week stretch of 2026 at $3.8 billion in combined inflows, including $986.9 million in the week ending September 5. Total net assets across the products reached $101.3 billion , and the 50-day and 200-day moving averages converged into a golden cross around September 11 . The previous three completed crosses were followed by moves of 50%, 45% and 60% .
The opposing side. This is not a clean macro picture. Markets are pricing a 58.4% probability of a 25bp rate HIKE at the September 15–16 FOMC — happening right now, not a cut. July PCE inflation ran at 3.7% year over year , August payrolls came in at 162,000 , and Brent near $97 is feeding the inflation problem. Year-to-date ETF net flows are still roughly $1 billion negative despite the recent surge, and a golden cross is a lagging signal that has reversed within weeks before.
The link. The FOMC outcome is the most likely cause of the retracement this idea is waiting for. A hawkish result does not break the structure — it hands the discount entry the chart is already asking for. Which is the entire point of having the levels marked before the event rather than reacting after it.
This analysis will be updated as the market evolves.
Best Regards, BigBeluga 🐳
TITradingView Ideas15 Sept