



Tether loses 251,350 Ethereum-based USDT wallets in 11 days
The decline in Ethereum-based USDT wallets may signal market shifts, potential consolidation, or migration to other blockchains, impacting liquidity.
 CryptoBriefing•Editorial Team6h ago
The decline in Ethereum-based USDT wallets may signal market shifts, potential consolidation, or migration to other blockchains, impacting liquidity.
CryptoBriefing•Editorial Team6h ago
Ducat's integration with TRON could significantly boost Bitcoin-backed stablecoin adoption, enhancing liquidity and stability in emerging markets.
CryptoBriefing•Editorial Team6h ago
Tether reportedly provided most of Gold.com’s outstanding precious-metal financing, revealing a relationship worth roughly $1.5 billion.
 AMBCrypto•Adewale Olarinde10h ago
ASTER/USDT is printing one of the cleaner textbook reversal structures on the daily chart, and it lines up almost perfectly with the token's first TGE anniversary (17 Sep 2025). Here is the sequence the market has walked through, step by step: 1. Exhaustion of the downtrend. From the November highs, price carved a series of lower lows and lower highs — a healthy, orderly markdown. This is the phase where late longs are flushed and supply is transferred to stronger hands. 2. Bullish divergence at the lows. As price pushed to fresh lows into February, the oscillator refused to confirm — momentum was rising while price was falling. That classic bullish divergence is typically the first tell that sellers are losing control. 3. Accumulation. Since February, price has traded sideways in a well-defined accumulation box between roughly 0.60 and 0.74. Volatility compressed, the moving averages coiled and flattened, and the range tightened — the signature of quiet distribution being absorbed before an expansion move. 4. On the brink of breakout. Price is now pressing the upper boundary of the box and has reclaimed the fast MAs. A daily close and hold above the entry trigger would confirm the range break and open the path toward the major resistance shelf. One honest caveat: a short-term bearish divergence has formed on the recent local high (visible on both price and the oscillator). That argues for patience — I want confirmation above the trigger rather than front-running the box. If the breakout fails and price loses the range, the structure is invalidated and the thesis is off the table until it rebuilds. FUNDAMENTAL BACKDROP The technical setup does not exist in a vacuum — the fundamental tape for ASTER is unusually constructive: What Aster is: a multi-chain perpetuals DEX (spot + perps across BNB Chain, Ethereum, Solana and Arbitrum) built from the 2024 merger of Astherus and APX Finance. It has positioned itself as a direct challenger to Hyperliquid, with hidden orders, MEV-resistant execution, stock/RWA perpetuals and yield-bearing collateral. It is backed by YZi Labs (formerly Binance Labs). Aggressive deflationary tokenomics. Since the June 2026 overhaul, up to 99% of daily platform fees are routed into ASTER buybacks for stakers, with a matching burn from reserves — a self-reinforcing loop where higher trading volume directly tightens supply. Cumulative burns have run into the hundreds of millions of tokens. Supply overhang removed. On 1 Sep 2026, the team extended the cliff on its 400M-token allocation (5% of supply) by a full year to 17 Sep 2027. Tokens that many feared would begin unlocking this month are now locked for another year — a materially cleaner near-term supply path than most peers carry. Product expansion. The Aster Chain L1, on-chain governance, staking, and RWA market growth continue to broaden the fee base — which, under the current model, feeds directly back into buyback pressure. Net read: strong deflationary mechanics plus a removed unlock overhang are exactly the kind of fundamental tailwinds that convert a technical accumulation into a sustained trend. TRADE PLAN Parameter Level Entry (on confirmed breakout) ~0.873 Take Profit 1 ~1.20 Take Profit 2 ~1.372 (major resistance) Stop Loss ~0.656 (below accumulation box) Execution notes: Trigger the long only on a decisive daily close and hold above ~0.873; avoid anticipating the box break given the local bearish divergence. Reclaiming and holding this level opens the door to the 1.20 shelf, with 1.372 as the extended target into major resistance. Scale out partials at TP1 and move stop to breakeven to lock in a risk-free runner toward TP2. Invalidation is clean: a breakdown and daily close below the box lows negates the setup. Not financial advice. This is a personal analysis shared for educational purposes — always do your own research and manage risk according to your own plan.

Stable com has integrated Polygon’s OMS, enabling stablecoin transfers across 180 countries. This development highlights the growing trend towards seamless digital currency transactions. As reported by the influencer @0xPolygon, users can now move USDT or PYUSD directly from their wallets into bank accounts, significantly enhancing accessibility in the crypto space. This move is expected to attract more users to the Polygon network and increase transaction volumes. What Went Down The integration of Stable.com with Polygon’s OMS marks a significant advancement in the accessibility of stablecoin transfers. Users can now transfer USDT or PYUSD seamlessly into their bank accounts, tapping into a network that spans over 180 countries. This initiative is part of a broader trend within the crypto market to enhance user experience and facilitate easier transactions. Given the current mixed signals across the broader crypto market, this development could drive increased network activity on Polygon as users seek more efficient ways to transact. Polygon is a layer-2 scaling solution designed to improve the transaction throughput of Ethereum by providing faster and cheaper transactions. The integration with Stable.com is a strategic move that aligns with Polygon’s mission to enhance accessibility and usability within the blockchain ecosystem. Given its jurisdiction over financial technology, Stable.com aims to leverage this integration to facilitate a more efficient transfer process for users globally. What to Watch Traders should observe the impact of this integration on Polygon’s transaction volume and active addresses. As more users engage with the platform, we may see a notable increase in on-chain activity. Additionally, keeping an eye on how this integration influences the broader market dynamics will be crucial. The potential for increased liquidity and user engagement could set the stage for future developments within the Polygon ecosystem.

Zoomex, a cryptocurrency trading platform with derivatives at its core, launched its first-week Copy Trading loss compensation campaign on September 16, 2026. Eligible participants can receive up to 50 USDT in Copy Trading Bonus. The campaign gives users an opportunity to explore trader selection, automated copying, and order management through Zoomex Copy Trading, with capped
 BeInCrypto•Zoomex13h ago
WLD is interesting around 0.3022–0.3112, an area that was defended repeatedly before the previous major bullish leg. During late July and early August, price returned to this range several times, produced multiple deviations below it, but continued to reclaim the area. That prolonged battle eventually resolved in favor of buyers and led to a large expansion higher. This is why I view the zone as more than a random local support. Long zone: 0.3022–0.3112 Invalidation: 0.2923 Risk: 1% If price revisits this structure and buyers defend it again, the available upside becomes substantial. My estimated potential is approximately 3–60% clean movement. The idea becomes invalid if price loses the entire zone and accepts below 0.2923. For me, the attraction here is the asymmetry: clearly defined downside versus a much larger recovery range above. #WLD #WLDUSDT #Crypto #Long
DOGE has a very clean historical structure around 0.06826–0.06997. Price spent a long period trading around this range before the previous bullish expansion. Sellers repeatedly tried to push below it, but failed to establish acceptance lower. Once buyers finally took control, DOGE moved sharply away from the area. That makes this range interesting again if price returns. Long zone: 0.06826–0.06997 Invalidation: 0.06642 Risk: 1% What I like most about this setup is the relatively short invalidation compared with the amount of space available above. If the zone holds again, I see approximately 3–45% potential clean movement. This is one of the more conservative setups from the current batch: well-defined structure, short stop and a clear reason why the zone matters. #DOGE #DOGEUSDT #Crypto #Long
COMP is approaching a price area that previously acted as a clear accumulation zone before a strong expansion higher. The 15.92–16.25 range was tested multiple times before buyers finally took control and pushed price significantly above $20. What makes this area interesting is not a single reaction, but the amount of time price previously spent accepting value here before the breakout. For this setup I am looking at: Long zone: 15.92–16.25 Invalidation: 15.54 Risk: 1% If price returns into this area and the structure remains valid, I see roughly 2–35% potential clean movement depending on how much of the previous expansion gets recovered. The stop is placed below the whole structure. Acceptance below 15.54 would invalidate the setup rather than simply represent another test of support. Clean zone, clear invalidation and enough room above to make the setup interesting. #COMP #COMPUSDT #Crypto #Long

Summary: Positioned squarely between foundation models and AI agents, B.AI is integrating compute routing, decentralized settlement, and full-stack agent infrastructure to establish itself as an undoubted spearhead in AI infrastructure. Just five months after its launch, B.AI has already set a new industry record with a daily throughput of over 1.51 trillion tokens—a 71,500x-plus increase since inception. B.AI achieved in just over 100 days what took OpenRouter, an early aggregation pioneer, roughly two years. Driven by the integration of settlement networks with core infrastructure, the exponential growth pulled off by B.AI highlights the viability of its full-stack commercial strategy while also demonstrating to the global market that the platform has risen to be the absolute leader in the next-generation AI infrastructure stack. B.AI has secured its leadership thanks largely to its ability to capture and cater to the global demand for cost-effective, high-performance Chinese LLMs. While offering homegrown LLM products a critical gateway for international adoption, the platform has also gained a head start by positioning itself as a global compute distribution hub. B.AI’s ability to rise in this tailwind is rooted in its unique ecosystem design. Co-incubated by TRON and YZi Labs, B.AI disrupts the market via a dual engine of settlement and distribution, plus its complete infrastructure for the emerging agent economy. The platform enables global access to top-tier LLM compute while equipping AI agents with native resource scheduling and execution capabilities—unlocking liquidity and value exchange across the global agent economy. Unprecedented Infrastructure Growth: B.AI Builds Global Distribution Hub for LLMs To reach 1.51 trillion tokens in its daily throughput, simply seizing the tailwind is far from enough. B.AI has also responded swiftly to two macro trends in the AI industry: the cost-performance advantage of leading Chinese LLMs and the surging demand for high-throughput, low-cost inference in the agentic era. Over the past year, Chinese LLM developers like DeepSeek, Kimi, Qwen, and GLM have matched top global benchmarks at a fraction of the API cost. This unbeatable cost efficiency makes adoption virtually inevitable for developers worldwide. As a global, next-generation infrastructure, B.AI aggregates top international models like GPT and Claude alongside rising Chinese LLMs. The platform has established close partnerships with Tencent, Alibaba, ByteDance, DeepSeek, Zhipu AI, Kimi, and MiniMax—all top LLM players in the Chinese market—to build a comprehensive model portfolio. This all-star model lineup has, in turn, made B.AI the default launchpad for Chinese LLMs seeking global expansion. Chinese LLMs, including DeepSeek-V4-Flash, Qwen3.8-Flash, and GLM-5.3 Flash, have stood out as top-performing models on B.AI with the highest usage. Building on the momentum, B.AI continues to drive adoption through model discounts, limited-time free access, tiered API pricing (with discounts up to 90%), and developer incentives, aiming to convert model cost efficiencies into usable throughput for developers worldwide. The traction from this strategic positioning is clearly backed by the numbers: B.AI’s daily token throughput has breached 1.51 trillion—a massive 71,500x-plus surge since its first day upon launch. Beyond its organic growth momentum, ecosystem partner YZi Labs serves as B.AI’s core distribution engine, continuously onboarding early-stage projects and developer communities. This ecosystem support enables B.AI to penetrate diverse real-world use cases, driving a steady influx of incremental traffic and commercial demand. For foundation model providers, B.AI’s multi-trillion, high-concurrency architecture provides a fast track to high-value global workloads. Within this massive pool of demand, B.AI has evolved from a simple distribution channel into a primary facilitator—scaling the commercial reach of leading LLMs while reshaping the global AI landscape. Beyond Aggregation and Routing: B.AI Builds Closed-Loop Infrastructure for the Agent Economy Yet for this super amplifier to truly sustain a trillion-dollar agent economy, front-end compute routing is nowhere near enough. Building on the API aggregation foundation pioneered by early movers like OpenRouter, B.AI recognized a critical insight: fully unlocking massive agent collaboration requires a closed financial loop at the foundational layer. To achieve this, B.AI bridges models and agents, creating a global settlement layer for intelligence. This core differentiator transforms the platform from a simple traffic conduit into the central master ledger for the entire agent economy, ensuring every cross-region call and task allocation is seamlessly routed, precisely metered, and automatically settled. To achieve this vision, B.AI embeds settlement directly into the infrastructure layer, creating a dual-track Web2 and Web3 payment network. Built on Web3 principles, the architecture maintains backward compatibility with traditional Web2 payment systems. On the Web3 front, B.AI leverages on-chain settlement channels to provide global developers with decentralized, verifiable, and low-friction options that enable fully automated transactions and micropayments between agents. On the Web2 front, it preserves legacy gateways like WeChat Pay, Alipay, UnionPay, and Visa, ensuring effortless integration into existing enterprise workflows. Together, this dual-track model delivers a single integration point for frictionless global capital flow. At the heart of this global liquidity is B.AI’s deep integration with TRON. As the world’s largest stablecoin transfer network, TRON offers B.AI a native payment rail through its massive USDT ecosystem, built for maximum liquidity and minimal friction. As of September 10, total TRC-20 USDT supply surpassed 94.2 billion, continuing to set record highs. Backed by TRON’s battle-tested on-chain capacity, B.AI provides the essential infrastructure required to scale cross-border compute scheduling and high-frequency automated agent micro-transactions. The true ambition of this architecture is to capture the emerging landscape of automated transactions in the agent economy ahead of the pack. The coming explosion in agent adoption will inevitably drive agent-to-agent (A2A) collaboration and autonomous commerce. Yet, fully unlocking this automated A2A synergy requires far more than just a foundational payment rail. B.AI builds beyond its Web3 smart settlement network by deploying a dedicated full-stack runtime environment for agents. This establishes an end-to-end, high-precision technical loop bridging compute scheduling, task execution, and financial settlement. At the scheduling layer, B.AI drives fine-grained compute allocation. Its tiered API system fundamentally reshapes compute procurement logic, offering structured invocation plans that allow developers to match specific business demands with optimal compute resources. At the execution layer, B.AI constructs a native agent collaboration ecosystem. It endows agents with direct operational capabilities to act across the digital world. Powered by embedded toolchains like Skills and Agent Wallet, alongside natively integrated AI assistants BAIclaw and BAI code, agents evolve into fully fledged digital workers capable of autonomous data acquisition and execution, laying a solid engineering foundation for multi-agent synergy. At the protocol layer, B.AI establishes foundational transaction standards for A2A commerce. This marks B.AI’s most strategically profound move. By natively integrating the x402 payment protocol and the 8004 identity authentication protocol, the platform paves a standardized path for mutual trust, identity verification, and high-frequency automated settlement between agents. From fine-grained model scheduling to intelligent collaboration systems and standardized transaction protocols, this architecture seamlessly fuses perception, reasoning, action, and settlement. This holistic infrastructure propels B.AI into a central hub for the agent economy, engineered to handle micro-transactions and compute settlement at scale. Crossing into the trillion-token era is merely a new starting point for B.AI. As next-generation AI infrastructure, its core value extends beyond distributing intelligence to powering transactions. By establishing foundational standards for high-frequency A2A collaboration, B.AI is reshaping the global flow of compute value, driving AI infrastructure into a new era built explicitly for agents and machine intelligence. B.AI Team Singapore support@b.ai
 NewsBTC•BlockmanPR16h ago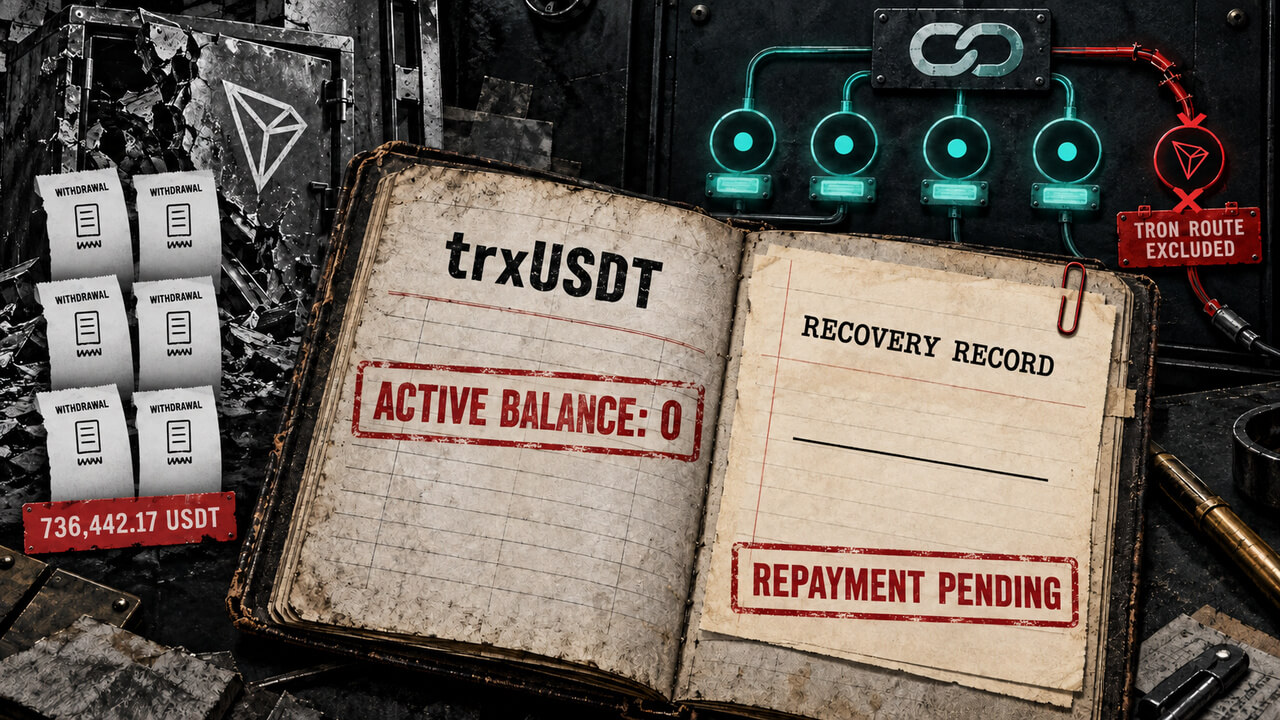
Providers retain a separate on-chain record of what they are owed, but Chainflip has not disclosed repayment timing.
 CryptoSlate•Liam 'Akiba' Wright17h ago
Seeing CRYPTOCAP:SOL push back to $100.xx and feeling the urge to FOMO buy? Take a step back and look at the market structure: 📌 TECHNICAL BREAKDOWN Wave (B) Corrective Push: Today's bounce from $96.83 is a textbook Wave (B) corrective retest, currently testing the 0.5 ($100.28) – 0.618 ($101.32) Fibonacci retracement cluster. Confluence Resistance: The descending channel trendline combined with heavy overhead supply blocks continues to cap any further upside momentum. Key Invalidation Level: As long as price remains below $106.93, the primary Bearish Impulse count pointing toward lower demand zones remains fully active. 💡 SPOT TRADING ACTION PLAN AVOID BUYING AT $100.xx: This is a No Man's Land. Buying inside Wave (B) offers a terrible Risk-to-Reward ratio. IDEAL BUYING SETUPS: Discount Scenario: Patiently wait for Wave (C)/(5) to complete near the main demand zone at $89.75 – $86.73. Breakout Scenario: Wait for a confirmed 4H candle close above $107.50 before flipping fully bullish. Protect your USDT/FDUSD cash position and let the market confirm its true direction! 🛡️ #Solana #SOL #CryptoAnalysis #TechnicalAnalysis #ElliottWave #BinanceSquare

Column has launched four new financial infrastructure products spanning stablecoins, card issuing, global banking and multicurrency accounts, giving fintech companies access to the services through a single banking platform. According to Column co founder William Hockey, the rollout completes a…

Upbit delayed JPYC trading to 3 p.m. KST on Sept. 17, while PYUSD kept its noon schedule across KRW, BTC and USDT markets.

☀️ Testing local breakout resistance near 99.62! Are you panic-selling this descending wedge accumulation, or locked in for the multi-wave breakout surge to the macro triangle resistance line? 🤔 Solana is executing a local descending wedge breakout following a major sell-side liquidity sweep down near $96.00 on this 2-hour Binance chart. SOL/USDT is trading around 99.62, pushing through the upper boundary of its local descending structure as institutional buyers step in to absorb sell volume and launch a multi-wave expansion campaign back up toward the upper boundary of the macro Triangle pattern. 📈💥 Look closely at the black blueprint trajectory mapping out the coming sessions. The algorithm projects a textbook multi-wave accumulation, retest, and expansion sequence: • An initial impulse push breaking above local descending wedge resistance toward the $100.80 - $101.00 region. ⚡ • A healthy higher-low pullback dipping back toward $99.80 - $100.00 to retest broken structure as new support and absorb remaining sell orders. 🌊 • A secondary expansion wave surging through intermediate structural hurdles to reach $103.50. 🧱 • A minor higher-low consolidation retest dipping back to $102.50 to solidify secondary launchpad support. ⚡ • Final acceleration surge driving straight up to target the macro horizontal Triangle pattern resistance ceiling near $107.00. 🎯🏹 Maintaining technical patience and aligning with trendline demand is your ultimate superpower in this setup. Trying to short directly into a confirmed descending wedge breakout following a deep sell-side liquidity sweep is a fast track to getting caught on the wrong side of an aggressive squeeze. Smart money is waiting for this higher-low retest above $99.00 - $100.00 to validate before riding the full recovery wave back to the macro ceiling. 🧘♂️⚡ 🛠 Trade Parameters: 🛒 Long Zone: 98.50 - 99.80 🛍️ 🛑 Stop-Loss: 2h close below 96.50 ❌ 💰 Take-Profit: 107.00 🎯 The retail bears attempting to short into this local wedge breakout are about to get caught offside as institutional buy volume takes total control. Stay focused, strictly manage your risk, and let the algorithm carry the trade up to our target. Maintain your composure through the waves, and we will see you up at the $107.00 resistance target ceiling! 🚀💎

Anchorage Digital has added institutional custody support for Etherlink and seven assets issued on the Tezos layer 2 network, including xU3O8, a token representing physical uranium. Anchorage Digital said institutional clients can now hold xU3O8, wrapped XTZ, stXTZ, USDT, USDC,…

AAVE/USDT is shown on the 1D Binance chart, trading around 122.20 USDT. Price remains below a clearly defined descending resistance trendline, formed by a series of lower highs since the 2025 peak. The recent rebound toward the trendline makes the 140–145 USDT zone the key breakout area. Key levels: Resistance: 140–145 USDT Current zone: ~122 USDT Support: 100–105 USDT Major support: 90–95 USDT Deeper support: ~60 USDT A daily close above 145 USDT could provide breakout confirmation. If confirmed, the chart structure could open a move toward approximately 180–200 USDT, with 200 USDT representing roughly +64% from the current 122.20 USDT zone. If price is rejected from the trendline and loses 100 USDT, the bullish breakout structure may weaken, with 90–95 USDT becoming an important downside zone. Watch for a confirmed daily breakout rather than treating the trendline test itself as confirmation.

Poland’s state energy company Orlen lost hundreds of millions of dollars after a covert plan to buy discounted Venezuelan crude using tether collapsed. Disappearing Millions and USB Drives A clandestine attempt by Poland’s state-controlled energy giant to purchase discounted Venezuelan crude using cryptocurrency has collapsed into one of the largest corporate and political scandals in […]
 Bitcoin.com News•Terence Zimwara21h ago
💵 Coin: CRYPTOCAP:NEAR / USDT ⏳ Time Frame: 6D 📉 Pattern: Inverse Head & Shoulders (H&S) 📍 Current Price on Chart: approximately $2.66 🎯 Neckline: approximately $3.10 🟨 Key Support Zone: approximately $1.75 – $2.00 The NEAR/USDT chart shows a potential Inverse Head & Shoulders structure following a prolonged downtrend. The pattern consists of three main components: the Left Shoulder, Head, and Right Shoulder, with the neckline positioned around $3.10. At the moment, price remains below the neckline, meaning the pattern has not yet received full breakout confirmation. The $1.75–$2.00 area is an important support zone because it also represents the potential formation area of the Right Shoulder. --- 🧩 Pattern Breakdown — Inverse Head & Shoulders 🔹 Left Shoulder: Formed after a decline, followed by a rebound from the approximately $1.70–$2.00 area. 🔻 Head: Price then experienced stronger selling pressure and formed a low around $0.84, creating the lowest point of the structure. 🔹 Right Shoulder: After rebounding from the Head, price retraced toward the $1.75–$2.00 zone, but has not formed a new low below the Head. This structure resembles the formation of a Right Shoulder. 📏 Neckline: The main resistance is located around $3.10. A strong breakout and candle close above this level would provide an important confirmation that the Inverse H&S structure is beginning to validate. --- 🟢 Bullish Scenario 🚀 Main bullish confirmation: NEAR needs to break above and hold $3.10. 📈 If the neckline breakout is confirmed with strong momentum, the Inverse Head & Shoulders structure could develop into a bullish reversal pattern. 🎯 Key resistance levels shown on the chart: $3.76 → $4.60 → $6.00 → $8.00 → $9.00 🔥 $3.76 becomes the first resistance area after the neckline. 🚀 If price successfully breaks above $3.76, the next area to watch would be around $4.60. 📈 A breakout above $4.60 could open the way toward $6.00. 💥 Next, the $8.00 area represents an important psychological resistance level. 🏆 The area around $9.00 represents the highest target/projection displayed on the chart and is also close to the previous high around $9.004. ⚠️ However, these levels are technical resistance/target zones shown on the chart, not a guarantee that price will reach them. --- 🔴 Bearish Scenario ⚠️ The bullish scenario becomes weaker if NEAR fails to hold the $1.75–$2.00 support zone. 📉 If price breaks down below this zone, the Right Shoulder structure could become invalidated. 🔻 Further downside could increase the possibility of price revisiting lower support areas. 💀 The most critical level within this structure is the Head low around $0.84. 🚨 If price eventually breaks below and forms a lower low beneath the Head, the Inverse Head & Shoulders structure shown on the chart would experience significant invalidation. --- 🔑 Key NEAR/USDT Levels 🟨 $1.75 – $2.00 → Support / Right Shoulder Zone 🔴 $3.10 → Neckline & Major Resistance 🟡 $3.76 → First Resistance 🟡 $4.60 → Next Resistance 🟡 $6.00 → Major Resistance 🟡 $8.00 → Psychological Resistance 🟢 $9.00 → Previous High / Chart Target Area 🔻 $0.84 → Head / Critical Invalidation Area --- 📌 Conclusion 🧠 Structurally, NEAR/USDT is forming a potential Inverse Head & Shoulders pattern on the 6D timeframe. 🟢 Bullish: A breakout and confirmation above $3.10 could provide stronger validation of the reversal structure and shift attention toward $3.76, $4.60, $6.00, $8.00, and potentially $9.00. 🔴 Bearish: Failure to hold $1.75–$2.00 could weaken the Right Shoulder structure. A move back toward the Head, particularly below $0.84, would represent an important invalidation of the Inverse H&S structure. ⏳ For now, the $3.10 neckline is one of the most important levels to watch. ⚠️ DYOR — Technical analysis does not guarantee future price movements. #NEAR #NEARProtocol #NEARUSDT #Crypto
📊 Technical Analysis 💵 Coin: AMEX:ARB / USDT ⏳ Time Frame: 6D 📐 Pattern: Descending Channel 📍 Current Price: around $0.165 --- 📐 DESCENDING CHANNEL 🔻 ARB has been moving within a long-term Descending Channel, with price forming a sequence of Lower Highs and Lower Lows since the 2024 peak. 📉 The channel resistance is represented by the red trendline, which has continued to pressure price from above. 📈 The channel support is represented by the yellow trendline, which has acted as a reaction area near the lower boundary of the channel. 🟢 The middle channel line also acts as dynamic resistance/support, making price behavior around this area important to monitor. 💡 As long as ARB remains inside the channel, the long-term structure continues to show bearish pressure. However, as price approaches the upper resistance, the possibility of a breakout becomes increasingly relevant. --- 🟢 BULLISH SCENARIO 🚀 Bullish confirmation would become stronger if ARB manages to break out and close convincingly above the descending trendline (red line). 📈 If a breakout occurs, the horizontal resistance levels shown on the chart can be monitored progressively: 🎯 Target 1: $0.222 🎯 Target 2: $0.266 🎯 Target 3: $0.330 🎯 Target 4: $0.396 🎯 Target 5: $0.457 🎯 Target 6: $0.585 🔥 The $0.457–$0.585 area represents an important resistance zone on this chart structure. 💡 If price manages to break through this resistance and maintain a bullish structure, the move could develop into a long-term reversal, rather than simply a relief rally. ⚠️ However, the breakout should ideally be confirmed through a candle close, volume, and the ability of price to successfully retest the broken resistance. --- 🔴 BEARISH SCENARIO 🔻 The bearish scenario remains valid if ARB fails to break above the descending trendline and receives another rejection from the channel resistance. 📉 If price moves deeper back into the channel, the following support areas should be monitored: 🛡️ Support: $0.165 🛡️ Support: $0.120 🛡️ Major Support: around $0.090–$0.070 ⚠️ If ARB loses the lower support area and forms another Lower Low, the long-term bearish structure could continue. 📌 As long as price has not successfully broken out of the channel, the breakout should not be considered a fully confirmed trend reversal. --- 🧠 CONCLUSION 🔎 ARB is currently approaching an important area within its long-term Descending Channel structure. 📉 Bearish: Price remains below the descending resistance and gets rejected → potential continuation within the channel. 📈 Bullish: Breakout + close above the descending trendline → opens the possibility toward $0.222 → $0.266 → $0.330 → $0.396 → $0.457 → $0.585. 🔥 Therefore, the red descending trendline is the key structural level to watch. A confirmed breakout could represent an important change in ARB's long-term market structure. ⚠️ DYOR — Not Financial Advice. #ARB #Arbitrum #ARBUSDT #Crypto