Solanapage 3

Coin · SOL · 1388 articles
Share

Coverage, page 3

page 3 of 70

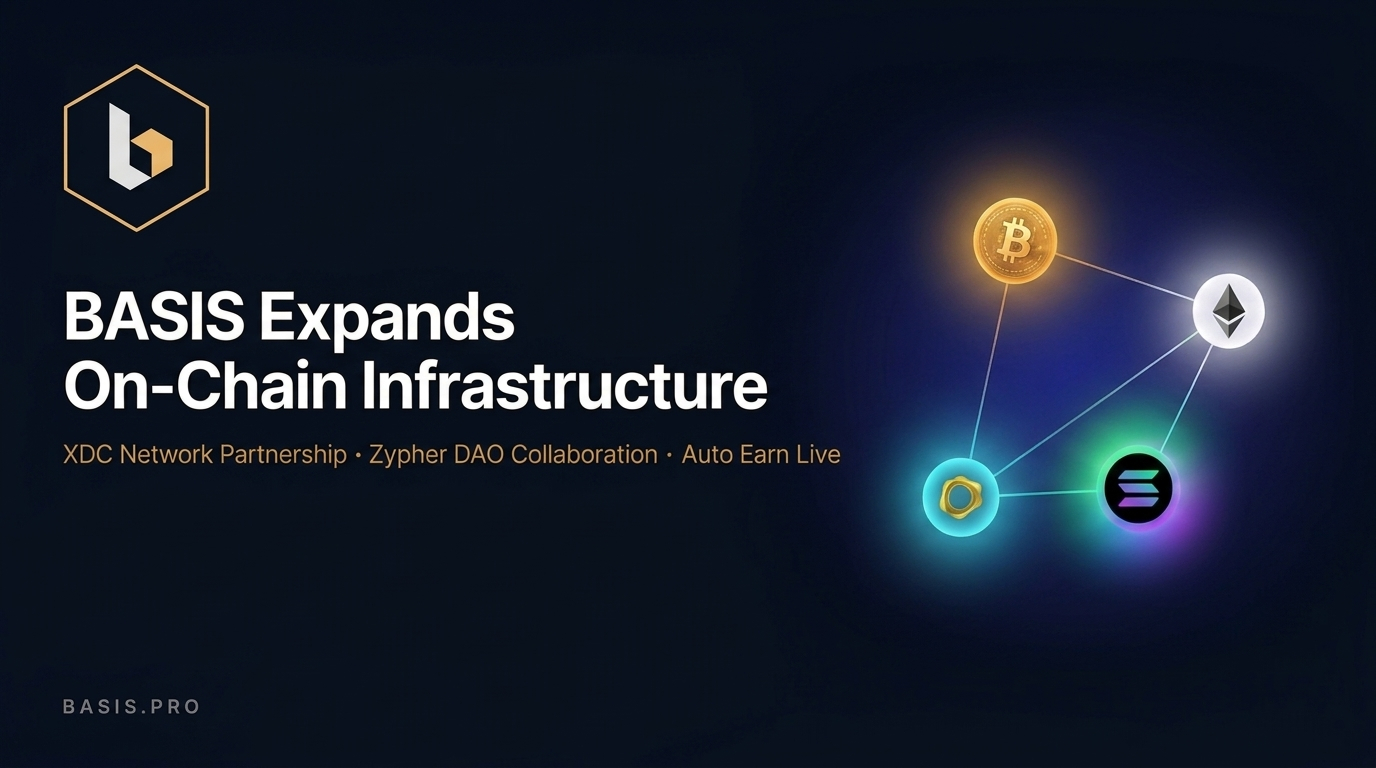
BASIS.pro Expands On-Chain Infrastructure with XDC Network Partnership and Zypher DAO as Auto Earn Goes Live

New developments extend BASIS across real-world asset and AI-native infrastructure while introducing automated reward restaking for BTC, ETH, SOL, and PAXG participants BASIS, the institutional-grade crypto yield and staking platform built on market-neutral execution infrastructure, is continuing to expand its institutional footprint with three new developments: an ecosystem partnership with XDC Network, a collaboration with

BeInCryptoBeInCryptoChainwire16 Sept

#SOLUSDT Final Liquidity Zone Before Expansion ?

#SOL The price is moving within a bearish channel on the 1-hour timeframe; it has reached the lower boundary and appears poised for a rebound. A retest of this boundary is expected, supporting some upward movement. The Relative Strength Index (RSI) indicates a bearish trend, but an upward breakout is likely due to oversold conditions on the 1-hour chart. There is initial support at 94.00, acting as a primary support zone. A key support zone (marked in green) exists at 92.00; the price has rebounded from this area multiple times, making it a strong support level. The price is moving toward the 100-period moving average—a level we are currently approaching—which supports a potential rise. Entry Price: 97.00 Target 1: 98.05 Target 2: 99.32 Target 3: 100.96 Stop Loss: At the green resistance zone. Remember this simple rule: Capital management. If you have any questions, please leave a comment. Thank you.

TITradingView Ideas16 Sept

BASIS.pro Expands On-Chain Infrastructure with XDC Network Partnership and Zypher DAO as Auto Earn Goes Live

[PRESS RELEASE – London, United Kingdom, September 16th, 2026] New developments extend BASIS across real-world asset and AI-native infrastructure while introducing automated reward restaking for BTC, ETH, SOL, and PAXG participants BASIS, the institutional-grade crypto yield and staking platform built on market-neutral execution infrastructure, is continuing to expand its institutional footprint with three new developments: […]

CryptoPotatoCryptoPotatoChainwire16 Sept

Solana : Triangle Breakdown—Is This Really a Bearish Reversal?

Solana : Triangle Breakdown—Is This Really a Bearish Reversal? SOL has broken below a visible triangle structure on the H4 chart. At first glance, this looks bearish. But when we zoom out and look at the higher-timeframe structure and the logarithmic chart, the picture becomes more complicated. The breakdown has happened, but several important support levels below price have not yet been decisively lost. That matters. A pattern can break while the larger market structure is still intact. So I don't consider this a high-conviction short setup yet. The Bigger Picture The recent move has been strong enough that the market may simply need to correct and rebalance before deciding on its next larger move. The H4 chart is therefore giving us a warning, not necessarily a complete reversal signal. For now, I would rather use the H4 structure to create a bearish bias and then move to the H1 timeframe to look for a cleaner short setup. That's a much better approach than selling directly into the H4 breakdown. The Important Scenario If SOL continues lower and the remaining support levels begin to break with acceptance, the bearish scenario becomes much stronger. But there is another possibility. If price returns higher and recovers a significant portion of today's decline, the breakdown could turn out to be a liquidity event rather than the beginning of a sustained downtrend. In that case, today's move may have done exactly what the market needed: remove liquidity → create fear → rebalance the market → prepare for the next move. This is why I don't want to make a strong conclusion from the triangle alone. Day Trading Plan For now, my focus is: H4: Directional context H1: Search for the short setup Lower timeframe: Entry confirmation If H1 gives us a clean bearish structure after a pullback, rejection or liquidity sweep, the short becomes much more interesting. If SOL instead reclaims the broken structure and recovers today's decline, I would step back and reassess the bearish thesis. Don't confuse a pattern break with a confirmed trend reversal. That's one of the most important lessons on this chart. Final View I would describe the current setup as: Bearish — but not yet high conviction. The triangle has broken, but the market still has important support underneath. The logarithmic view also reminds us that after a strong directional move, correction is normal. So rather than predicting that SOL must continue falling, I'm watching the H1 structure for confirmation. If sellers prove themselves, we trade the short. If the market reclaims the breakdown, we don't force the idea. The chart doesn't owe us the direction we expect. Our job is to react when the structure confirms it. Fundamentally, Solana continues to have a large and active ecosystem across DeFi, payments, consumer applications and other on-chain activity. Recent network developments include the activation of Transaction V1, which increases the maximum transaction size from 1,232 to 4,096 bytes, expanding what can be executed in a single transaction. At the same time, SOL remains highly sensitive to broader crypto liquidity and market risk. Recent market coverage has highlighted the importance of the roughly 100 Dollar area and the 103–106 Dollar resistance region, showing that price remains in a technically important area rather than a clean one-directional trend. Risk Warning: This analysis is for educational purposes only and is not financial advice. Crypto assets are highly volatile. Wait for confirmation, define your invalidation and never risk more than you can afford to lose.

TITradingView Ideas15 Sept

SOL/USDT Bearish Breakdown — Target 95.71**

SOL is showing strong bearish momentum after breaking below the **102.00 support/BOS area**. Price has rejected higher levels and is now trading around **97.93**, confirming downside pressure. **🎯 Target:** 95.71 **📉 Bias:** Bearish / Sell **⏱️ Timeframe:** 1H **⚠️ Key Resistance:** 102.00–105.00 A sustained move below the recent lows could open the way toward the **95.71 target**. Trade with proper risk management and wait for confirmation before entry.

TITradingView Ideas15 Sept

SOLANA: Approaching the $97.22 Demand Zone — Long Setup Ahead?

SOLANA: 13-Day Range — Watching the $97.22 Bottom for a Long Setup Solana has been trading inside a clear range between $97 and $107 for almost 13 days, and the price is now approaching the bottom of this range around $97.22. At this area, I’m looking for potential long opportunities. There are two ways I would consider entering this trade: 👇👇 1. Risky Limit Entry For a more aggressive approach, you can place a limit order around $97.22. For the stop loss, there are two options: - Risky SL: $94.48 - Safer SL: $92.12 Personally, if I were taking the limit-entry approach, I would prefer the safer stop loss at $92.12 to give the trade more room. For the targets, you can manage the position based on R:R: - TP1 = 1R - TP2 = 2R - TP3 = 3R If we get the long entry near the bottom of the range, the main idea is for SOL to move back toward the top of the range around $107. 2. Confirmation Entry The second approach is to wait for confirmation instead of entering immediately at $97.22. Once the price reaches the bottom of the range, I would look for a clear reaction from the area, such as a strong bullish candlestick or a change in market structure from bearish to bullish. If that confirmation appears, we can then look for an entry with confirmation. This approach may provide a higher-probability setup, although the entry could be at a higher price and the potential R:R may be different. So, personally, I prefer waiting for the reaction and confirmation rather than blindly entering at the bottom of the range. However, if you want to take the limit-order approach, the $97.22 area is the level I’m watching, with either $94.48 or the safer $92.12 stop loss. If #SOL reaches the top of the range around $107, that would be the main area to watch. And if the price breaks above the range with strong momentum, SOL could potentially continue higher. As always, manage your risk properly and don’t risk more than you can afford to lose.

TITradingView Ideas15 Sept

Solana’s blockchain gaming debate is shifting: Web3 opportunity may be moving around the game

Solana’s blockchain gaming story is getting more complicated. In March 2026, Solana Foundation President Lily Liu publicly argued that gaming on a blockchain was not coming back, even as Solana’s own developer resources continued to promote Web3 gaming tools, digital assets, wallet-based authentication, token payments, and on-chain economies. That tension may say more about the Continue reading "Solana’s blockchain gaming debate is shifting: Web3 opportunity may be moving around the game"

AMBCryptoAMBCryptoAMBCrypto Team15 Sept

Solana (SOLUSDT) 4H

Trade Details: Asset: SOL / USDT (4H Timeframe - Binance) Position Type: Long / Bullish Rebound Setup Entry Zone: At the convergence of the EMA 200, the 38.2% Fibonacci retracement level, and the lower boundary of the descending channel. Take Profit (TP): First Target (Small Target): Midline of the channel. Main Target (Large Target): Upper boundary of the channel. Stop Loss (SL): Positioned safely below the entry confluence zone. Risk/Reward Ratio: 2.83 Confluence Factors: Structural & Dynamic Support: Strong technical alignment between the 4H EMA 200, key Fibonacci retracement (38.2%), and channel support. Clear Target Structure: Multi-tiered profit objectives aiming first for solvent midline targets and extending towards the upper resistance trendline. High-Probability Rebound: Price action respecting the descending channel parameters, offering a compelling risk-to-reward outlook. (Disclaimer: This analysis is for educational purposes only and does not constitute financial advice.)

TITradingView Ideas15 Sept